Keep WordPress speedy by resizing images

When you upload an image to WordPress, it is stored in its original size on the web server. WordPress allows you to specify an image size. WordPress will create an additional copy of the image at that size and insert that in the page instead.

Here is an example:
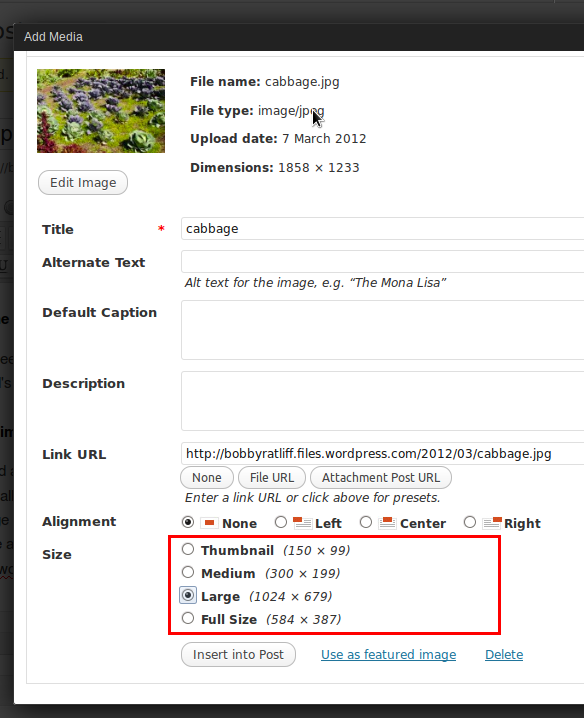
Original size: 1858×1233 (652 kB)
Wordpress copy: 1024×679 (336 kB)

This means that when people view your page, they have to download 0.5 times the original file size. This is a smaller file download, and it will help your page load faster.

Point to remember: If you choose a size when you insert an image, it tells WordPress to create a smaller file download. This will help your page load faster.

Resizing images

After inserting an image and viewing the page in a web browser, usually you’ll find that your image is too large. So then you go in the Edit Image window and set a smaller size, e.g. 70%:

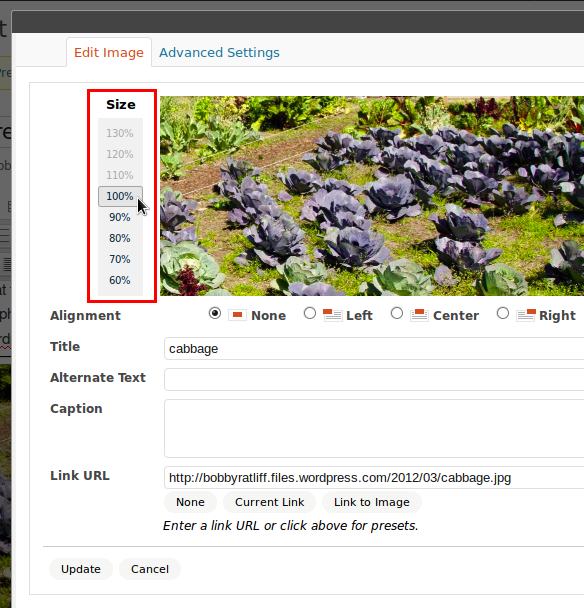
This presents a problem: If you use the Edit Image window, WordPress will not automatically resize your image file a second time. It will only display the image smaller. This means that the web browser is still downloading the full size file, but it is just viewing it smaller.

I tried resizing the cabbage image above to 70%. Here is what happened:

WordPress size: 1024×679 (336 kB) — Recall that this is due to our choice of size in the Insert Image box.
New size at 70%: 717×475 (336 kB) — But this image could be 186 kB if I resized the actual file.

See the difference? If you resize an image with the Insert Image box, it will actually save space, but if you resize an image with the Edit Image box, it will not actually save space.

Conclusion

Correctly scaling your images before inserting them into a post will solve this problem. If you are going to be inserting a lot of images, use a test image. Insert a single image and use the Edit Image box to find out what size looks right. Then on your computer, resize all your images to this size before inserting them into the post.

Misc notes

Another thing you have to take into account when viewing images is the maximum width of the content in your theme. For example, this blog (bobbyratliff.wordpress.com) uses the Twenty Eleven theme, where the maximum width is 585. Even if I choose the 1024×769 option, the image width is limited to 585. In other words, it will show the cabbage image as 570×377.

Another solution is to add image sizes to the insert image dialog. If you have hosted WordPress, you can use the Additional image sizes plugin to do it.

Google Page Speed is a great tool for troubleshooting slow sites. It has a list of rules that it evaluates your website against. When your page breaks a rule, it will tell you why and give some clues on how to fix it. The information in this post applies to the suggestion “Serve scaled images.”

Computer animation project

One of the fun results from my computer graphics class last semester was our computer animation project. The assignment was to model the firing of a cannon, including the cannon recoil and the projectile’s parabolic trajectory. The end goal was to use this model to drive a 3D animation.

I worked with 2 other group members, and in all I spent 54 hours in group meetings and coding individually. The project resulted in about 4000 lines of code in 34 Java files.[1]

Physics modeling

For each frame of our animation, we make slight changes to the position of each object on screen. These small changes are based on simple physics calculations.

For example, for a wheel to roll to the left, it needs to both rotate counter-clockwise and move to the left. The angle of rotation \Delta\theta is related to the shift to the left \Delta s by the following equation:

\Delta s=r\Delta\theta

where r is the radius of the wheel.

Firing the projectile gives the projectile some initial velocity. This velocity can be used to compute a change in position for the projectile. The velocity changes over time due to acceleration due to gravity.

2D animation

First, we produced a 2D animation of this model. This involved several steps:

  1. Read in 3 objects : the projectile, and the wheel and the barrel which make up the cannon. These objects can be drawn on-screen in a certain order so the layering appears correct
  2. Move them to their initial position.
  3. For each screen refresh, update the positions of the objects based on the equations.

Initially, the projectile has 0 velocity, so item #3 above really means that nothing will change in each screen refresh. As soon as the user presses the fire key, the projectile is given a fixed amount of velocity (and the wheel is given an amount of recoil velocity).

3D animation

Making the 3D animation was the more challenging part of the project. While the 2D animation was written in about 10 hours, the 3D animation took 44 hours to write, including a 13 hour rabbit trail. I spent about 13 hours working on a version that ended up not working.

The 3D animation extends the work of the 2D animation. Instead of a 2D wheel, barrel, and projectile, we now have 3D objects. These objects are first generated and then stored in .dat files. There are now 6 objects: the ground, 2 wheels, the axle, the barrel, and the projectile.

Based on the source code from our textbook, the 3D objects are put into a scene which can be viewed from different perspectives. We added code to rotate and move individual objects based on the amounts specified by our physics model.

Here is a demonstration:

The video demonstrates two methods of rendering that our 3D cannon animation supports. The first is z-buffering, and the second is hidden line elimination. These two methods are described in my first post about computer graphics class.


[1] This is a raw count, produced by doing wc -l *.java. Not all 4000 lines are original code for this project. Some of this code was first implemented in our textbook,  Computer Graphics for Java Programmers, 2nd ed., by Ammeraal and Zhang. There are also 6 Java programs for generating the data files for the various on-screen objects. These Java programs have a lot of code duplication.

What I learned from computer graphics class

Besides my course in evolutionary computing, which I learned a lot from, last semester I took a class in computer graphics. In this class, I learned about different aspects of computer graphics, including modeling and rendering objects to a screen.

I definitely appreciated how computer graphics class built upon knowledge that I had already gained in previous subject areas:

  • Geometry
  • Linear algebra
  • Java programming

Modeling 3D objects

We modeled 3D objects as collections of points in a 3D space. Each object has a number of faces, where a face is a collection of points (a polygon) that make up a face of that object. Each face must be flat. So, for example, a cylinder would be made up of a finite number of long thin faces.

Rendering 3D objects

A simple rendering is to draw a line around the edges of each face in the object. This would be called wire-frame rendering. A slightly more complex rendering is to ensure that lines are hidden if a face falls in front of that line. This is called hidden-line elimination. A cylinder is displayed here as rendered with hidden line elimination:

Cylinder displayed with hidden line elimination

A more realistic rendering gives a color to each face and fills it in. The face’s color can be shaded according to the direction the face makes with a light source. One simple method of rendering these shaded faces is called z-buffering. Here’s a screenshot of a z-buffer rendering of the same cylinder:

Cylinder drawn using z-buffer

The role of a computer scientist

When I meet people, I often end up telling them that I am a college student, and my major is computer science. “So what are you going to do with that?” they ask. “Programming” is my usual answer. There are many possible careers for computer science majors, but in this post I’d like to write about the role of a computer scientist. What is a main, overarching goal to our work?

Frederick P. Brooks gave a speech in 1994 in which he addressed the goal of computer science. The transcript is entitled “The Computer Scientist as Toolsmith II.” In it, he argues that when computer scientists write programs, their primary goal is to satisfy the needs of the user. Users will use our tools to get their job done. In short, we are toolsmiths. Brooks writes, “We make things that do not themselves directly satisfy human needs, but which others use in making things that enrich human living.” In other words, an engineer can use a computer drawing program as a tool to design a bridge. Or a parent will use a social networking program as a tool to communicate with friends.

In making our tools, we should make them well. It goes without saying that the tool should not break when you are trying to use it. The tool should not be too complex or hard to maintain. When we work as toolsmiths, we should do good work.

Merely talking about how we make our tools does not fully address the question. We also need to address this question: What types of tools should we make? To discern this requires some sense of morality. Wolterstorff writes,

There is something deficient about the person who does good work for its own sake without ever asking whether it’s a good thing that this work be done. The estimable craftsman asks two questions concerning the good. He asks whether what he is doing or making for its own sake is a good example of its kind: a good violin, a good arpeggio, and so forth. But he also asks whether doing or making a good example of this kind is a good thing to do. (quoted in Think, by John Piper, page 120)

In other words, we should ask two questions:

  1. Is this a good tool?
  2. Is making a tool of this type a good thing to do?

The second question is a challenging question to ask. It is a question that transcends individual preference. At the very least it requires people to think ahead of possible uses of their tool. I do not wish to analyze every tool that has ever been made and fit it in this grid. I do wish, however, to provide two examples of tools where this question should have been asked.

The first is the recent flu virus that was genetically modified to travel via airborne particles. Basically, a deadly flu virus was made even deadlier. The US government asked the researchers to limit the amount of information is published in academic journals, for fear that the findings would be turned into a flu pandemic. The New York Times has an article on the deadly flu virus. One researcher went so far as to say, “This research should not have been done.” In other words, it was not a good thing to even do this kind of research, even if it was done well.

The second example is the trend of personalization in internet websites. This results in “a bubble” around you that only includes news that you want to hear. For example, search engines change their first page of results depending on who is searching. Facebook internally sorts your friends into who you want to hear from and who you do not. This has been explained at dontbubble.us and in a recent TED talk, “Beware online ‘filter bubbles’.” When a computer filters our results based on what we like, we miss out on things we need to hear. A human newspaper editor can create a balance of different articles on a front page, but a computer filter will only put things that we want to hear. The filtering technology is very good at what it does, but it is not a good tool, as it dulls our thinking and takes away our exposure to ideas we disagree with.

In conclusion, the computer scientist has two roles: to make tools well, and to determine which tools should be made. This requires both technical expertise and a moral compass. It is my desire to see more and more programmers have a moral compass to guide them in their work.

What I learned from Evolutionary Computing

875 lines of code and 55 hours. Evolutionary Computing was one of the most challenging courses I have taken at SCSU. These statistics come from our final project, which was a month-long research project. Our assignment was to build on previous projects and produce a 5-page paper suitable for publication at a conference.

I learned a lot while completing this project. My project studied spanning trees on complete graphs, and how to evolve them using a genetic algorithm. Maybe in a follow-up post I’ll introduce these concepts. For now, I want to show what I learned while writing those 875 lines of Python code.

  • Write a testing function for non-trivial tests. I was checking something by hand, and thought my program wasn’t working. Then I ended up spending several hours debugging something that was not in fact a bug.
  • Dropbox is an automated version control. Several times I used it to retrieve an old version of a file that I had not committed. This came in very handy.
  • In vim, you can do :edit! to reload a file from disk. (documentation here)
  • Time estimating is important when running your jobs on other people’s machines.
  • I learned how to profile code using cProfile. On Ubuntu, cProfile can be found in package python-profiler.

Git

In git, you can choose to commit only certain changes in a file. It can be done by using git gui. The GUI basically shows you the output of git diff for the changed files in your repo, and you can right click on a line in the diff and choose “Stage Line For Commit.”

I only used this a few times, but it is a lot better than doing the following:

$ cp dandelion.tex dandelion.tex.bak
$ git checkout -- dandelion.tex
$ #manually copy over the changes that you do want to commit
$ git add dandelion.tex
$ git commit -m "This is the hard way"

LaTeX

When writing tables in LaTeX, you must put the label in the caption in order for it to refer to a specific table number. If you don’t, your ref will only refer to the number of the section. Here is a working code snippet:

The times can be seen in Table ref{wallclock}.

begin{table}
caption{Wall clock times in seconds for a single
run of the genetic algorithm using the PyPy interpreter.
 label{wallclock}
}
begin{tabular}{l r}
...
end{tabular}
end{table}

Careers for computer science students

I have often described to people the difference between computer science and information services (IS) majors. Both are offered at St. Cloud State University (SCSU), but they have much different purposes.

Computer science is a technical major, focused on data structures and algorithms. Computer science students take several math classes, as well as some science electives. IS is a business major, and it focuses on computer programming’s usefulness to business. IS majors do not have many math courses to take.

These different majors present different career options.

Computer scientist

First, there is a computer scientist. These workers “are the designers, creators, and inventors of new technology,” in other words, they do research. Most of them have a Ph.D. (In computer science, of course.)

Majoring in computer science at SCSU, I get a taste of some different topics that computer scientists study. For our undergraduate degree, we are required to take 5 upper-level electives. This semester, I am studying evolutionary computing and computer graphics. These classes present material that is fascinating to me, and we only scratch the surface of what a computer scientist would study. (For an example, see a description of evolutionary computing.)

Computer systems analysts

This summer I had an internship at a financial company. The work I did there would fall under the career of computer systems analysts. I would say a computer systems analyst could be anyone with problem solving skills, including both computer science and IS majors.

“Computer systems analysts use IT tools to help enterprises of all sizes achieve their goals. They may design and develop new computer systems by choosing and configuring hardware and software, or they may devise ways to apply existing systems’ resources to additional tasks.”

An example of a project a computer systems analyst would work on is to determine a good tool for doing version control on application software that the company maintains. The programming of the application itself falls to the computer programmers, but the configuration of the version control, as well as the build environment falls to the computer systems analysts.

Computer programmers

Then there are computer programmers. Programmers apply problem solving skills to the creation and improvement of software. Their work can be further divided into systems programming and applications programming. To be a computer programmer, you need sufficient programming experience, and a good way to get this experience is in the computer science or IS major.

Computer programmers can work in many different industries. Some industries are more technical than others. An obvious way to tell the difference is by the interview requirements. One of my fellow interns from the summer wrote this article about his interview experiences.

The financial company I worked for this summer has a very business-focused interview. Jon describes it well: “They want to know that you think logically enough to work things out so they can train you to do things their way.”

Other firms, like developer firms, have more technical interviews. These focus on coding ability. For example, they will have an interactive editing session with you and say, “write a stack.” This allows them to screen applicants who do not have sufficiently deep knowledge of programming.

3D graphics on Linux

As I mentioned in my post about free software, one of the problems with my current Ubuntu installation is my use of a non-free graphics driver. I would prefer to find a way to use free software and still have some hardware acceleration support, e.g. for compiz and for video playback. (I found a good tutorial on how to fix video tearing.)

As a side note, I have a free graphics driver with hardware acceleration working on my Eee 900. This is mainly because the eee pc has Intel integrated graphics. On the other hand, its performance is nothing to write home about.

The target system is an HP Compaq dc7900, with an ATI Radeon HD 2400 XT (RV610). I am currently running Ubuntu Linux 10.04 LTS with the fglrx driver.

Testing your existing setup

The old way to check for hardware acceleration was the following:

$ glxinfo | grep rendering
 direct rendering: Yes

where a Yes means you do have rendering. However, I learned that a system can answer yes even if it is not using hardware acceleration. The proper command is:

$ glxinfo | grep OpenGL
 OpenGL vendor string: Tungsten Graphics, Inc
 OpenGL renderer string: Mesa DRI Intel(R) 915GM
GEM 20100330 DEVELOPMENT x86/MMX/SSE2
 OpenGL version string: 1.4 Mesa 7.10.2
 OpenGL extensions:

The item of interest is the “renderer string.” If it says “Software rasterizer,” then your system is emulating OpenGL instead of using hardware acceleration. Here is some more documentation on how to check your setup using glxinfo.

Some definitions

  • OpenGL is a standard specification for writing applications that produce 2D and 3D computer graphics. Basically, it is an API.
  • Mesa 3D is an open source implementation of OpenGL, providing the library that applications can call into.
  • Direct rendering interface (DRI) are drivers that Mesa uses to translate OpenGL function calls into GPU-instructions.

When the DRI is present, this would constitute hardware acceleration. It has a userspace component and a kernel space component, which is the direct rendering manager (DRM)

The “driver” that is specified in xorg.conf is actually a relatively basic driver that performs the 2D tasks, including compositing and video acceleration. All 3D calls are passed on to Mesa. See the section about DDX (Display Driver for X) in Linux Graphics Driver Stack Explained.

Kernel Mode Setting (KMS) is the notion that the code to set the video card’s mode is moved into the kernel. The mode is the color depth and resolution of a monitor. Previously, the mode setting code resided in the X server. In the new scheme, it resides in the kernel. This provides the following advantages, as given in Debian 6 Release Notes:

  • More reliable suspend and resume
  • Ability to use graphics devices without X
  • Faster VT switch
  • Native mode text console

Tools for syncing

Here’s the situation: I have accounts on multiple computers. Who doesn’t have this problem these days? (If you’re in the top 1% of the world’s richest who own a computer, that is.) I have a netbook running Xubuntu, a desktop triple booting Ubuntu, Debian unstable, and Windows Vista, and several accounts at school. I want to be able to sit at any one of these computers and be as productive as possible.

My solution has several parts to it. For me to be productive, I want to have access to several different kinds of information, including:

  • bookmarks
  • email, including contacts
  • documents

For each kind of information, I have a different way of accessing it, depending on the level of configuration I can perform on the particular computer I am using.

Bookmarks

I store my bookmarks on Google Bookmarks. Google bookmarks has a web interface for accessing and managing bookmarks. Bookmarks are stored by URL, so the URL is not editable except by deleting and creating a new bookmark. Otherwise, I can edit the title of the page, and tag the bookmark to organize it how I please.

The first software tool I used to access Google Bookmarks was GMarks. (GMarks is free software.) GMarks is a Firefox extension, so I can install it on any account where I have access to Firefox. Thankfully my school has the Firefox web browser on their lab computers, and they allow students to add their own extensions. GMarks adds a menu to the toolbar with bookmarks pulled from Google Bookmarks. The bookmark tags or labels are used to generate the menu, with the ‘>’ character used to represent subfolders. I prefer to sort my bookmarks by date, so the most recently added ones appear near the top.

More recently I have been using Google Chrome for my web browsing. The software tool I use in this browser is Yet Another Google Bookmarks Extension (YAGBE). As this tool is not free software, I am in the market for a replacement that behaves similarly. YAGBE adds a star to the toolbar next to the URL bar. (This is to the right of the star that is already in the URL bar, which is for Chrome Bookmarks.) This is handy, and a little more compact than the default GMarks behavior. The star turns yellow when you are on a page which you have already bookmarked. Clicking the star reveals a menu with your bookmarks.

Screenshot of the star that YAGBE puts in the toolbar

Email

The obvious solution to email is to use a provider with IMAP access. I prefer to use a native client to a web client where possible. I use Thunderbird on the machines I administer, and on the school lab computers, I have configured Outlook to interface with my personal email as well as my school email.

The more interesting part is contacts. At some point I got fed up with all my Thunderbird instances pulling their own contacts into the “Collected Addresses” list. I was also fed up with searching my email inbox to confirm a particular email address for one of my friends. I decided to use Google Contacts (part of gmail) to store all the email addresses for my contacts. Similar to tags, Google allows you to add a contact to multiple groups.

There is a Thunderbird extension called (you guessed it) Google Contacts. This extension is free software. If you set up your Gmail account in Thunderbird for email, it will automatically use your username and password to pull in your contacts and add them as another address book. All of the groups from Gmail are created as Thunderbird Mailing Lists, so you can use them to find a contact if you desire. Otherwise, it behaves like the other address books, so you can use autocomplete.

Screenshot of the Google Contacts address book in Thunderbird

Documents

For my documents, I simply use Dropbox. (This is not free software.) On computers where I can install it, I do. When I cannot, I use their web interface to get the files I need.

In some situations, I’ll make an exception, and put a document on Google Documents so other people can edit it. I have also used Zoho Notebook to create a paged log of my computer hacking adventures. This allows me to edit the same notebook from whichever computer is running, which is usually not the same as the one that is being experimented on!

Do what you enjoy

The CEO of Securian Financial Group told me, “If you’re not having fun, you’re not doing it right.” The CIO told me, “Do what you enjoy.” I’ve been spending the past few weeks thinking about what I will do after completing my undergraduate degree here at St. Cloud State University. I’ve found that many different sources of career advice focus on doing what you enjoy.

Scott Belsky has an article entitled “Finding Your Work Sweet Spot.” He describes this sweet spot as an intersection of three different factors: interests, skills, and opportunities. Interests is defined by what you love to do. “A genuine interest is not about what promises the most economic gain. On the contrary, it is a topic that trumps economic concerns because you love it so much.”

I am learning to use my interests and skills to navigate some of the many opportunities that confront me. A quote from Dan Pink on Matt Perman’s blog says that choices should be based on your values, not based on utilitarian reasons.

You can do something for instrumental reasons — because you think it’s going to lead to something else, regardless of whether you enjoy it or it’s worthwhile.

Or you can do something for fundamental reasons — because you think it’s inherently valuable, regardless of what it may or may not lead to.

If I am focusing on doing what I enjoy, I can make every decision based on fundamental reasons. I won’t always know where I am going, but I am enjoying the steps on the way. Belsky agrees, writing: “Define ‘opportunity’ as an action or experience that brings you a step closer to your genuine interest. Opportunity is less about leaps forward and more about the slow advance.”

I don’t know where I’m going, but I know where I am. There is no master plan, other than pursuing what I enjoy. A quote from Peter Drucker supports this:

Successful careers are not planned.

They develop when people are prepared for opportunities because they know their strengths, their method of work, and their values. Knowing where one belongs can transform an ordinary person — hardworking and competent but otherwise mediocre — into an outstanding performer.

(The quote is from a PDF entitled Managing Oneself.)

I think to be prepared for opportunities entails

  • finding opportunities around you (networking)
  • choosing to engage those opportunities or not
  • engaging opportunities for fundamental reasons

Power usage

I recently purchased the P3 Kill A Watt EZ (model 4460), and I have been using it to measure the power usage of a few items around my dorm room. I was originally inspired to do this from one of Jeff Atwood’s posts on power usage.

Desktop power usage

The first item I measured was my tower, the HP Compaq dc7900. It has the following specifications:

Intel Core 2 Duo E8400
4 GB RAM
Seagate 160GB
Western Digital 500 GB
ATI Radeon HD 2400 XT

The power measurements are as follows:

switched off 3 watts
on, idle 60 watts
on, BOINC at 50% 80 watts
on, BOINC at 100% 90 watts
suspend 4 watts

BOINC is free software that allows you to participate in a variety of distributed computing projects, and I used it to perform some CPU-intensive tasks for my testing. When I say BOINC at 50% and BOINC at 100%, I was utilizing BOINC preferences. It has an option, “On multiprocessor systems, use at most __% of the processors.” My system has 2 cores, so the 50% roughly corresponds to one core at full utilization, and 100% corresponds to both cores at full utilization.

It is interesting to compare these measurements to Jeff Atwood’s measurements. Two articles from 2005 give measurements of 118 w for a desktop, and 160 w for a server. My dc7900 specs are strikingly similar to Jeff’s 2005 desktop, and mine was a budget model purchased in 2009. For similar performance computers, we come to the conclusion that idle wattages have dropped by half in 5 years.

Probably more instructive is a comparison with Jeff’s 2011 Home Theater PC, which draws 22 watts idle. This is with a Mini-ITX board, and other power-saving goodies.

Monitor power usage

The next item I measured was my 22 inch widescreen monitor, an HP L2245wg. I learned that switched off and in power save mode, it uses the same amount of power, 3 watts. Switched on, it uses different wattage depending on the screen brightness.

on, 0 brightness 21 watts
on, 50 brightness 29 watts
on, 100 brightness 42 watts

Looking at the results, I was rather shocked that the power usage doubles when the brightness is turned up. It is better to keep your monitor’s brightness down, and this is best practice for monitors anyway.

Laptop power usage

Finally, I measured the power usage of my Eee PC 900, which I had recently installed Xubuntu 11.04 on. The power measurements are as follows:

idle at Xubuntu desktop, minimum brightness 16 watts
idle, wireless switched off 14 watts
idle, wireless on, maximum brightness 17 watts

Then, out of curiosity, I booted my Eee PC with Minix 3, since it is a small operating system designed for embedded use. I used version 3.1.2a for USB stick, which can be found in the MINIX previous versions. (The latest stable release is 3.1.8.) The power usage of this was 15 watts.

In summary, for my laptop, there is strikingly little difference between minimum brightness and maximum brightness. The difference between MINIX and a full-fledged operating system, Xubuntu, is minor as well.

It is also interesting to compare my Eee PC’s power usage with some of Jeff Atwood’s measurements. His Dell XPS M1330 (in 2008) used 20 watts idle, and his Dell Inspiron 300m (in 2006) used 15 watts idle. From this small amount of data, I can jump to the conclusion that, unlike desktops, laptops have not significantly improved their power usage.